Welcome to Geonova
Your AI-powered platform for urban planning and geospatial analysis. This guide will help you understand how to use Geonova to analyze cities, explore planning recommendations, and visualize urban development scenarios.
Getting Started
Geonova provides a 3D interactive globe powered by CesiumJS that allows you to explore any city in the world with real terrain, buildings, and satellite imagery.
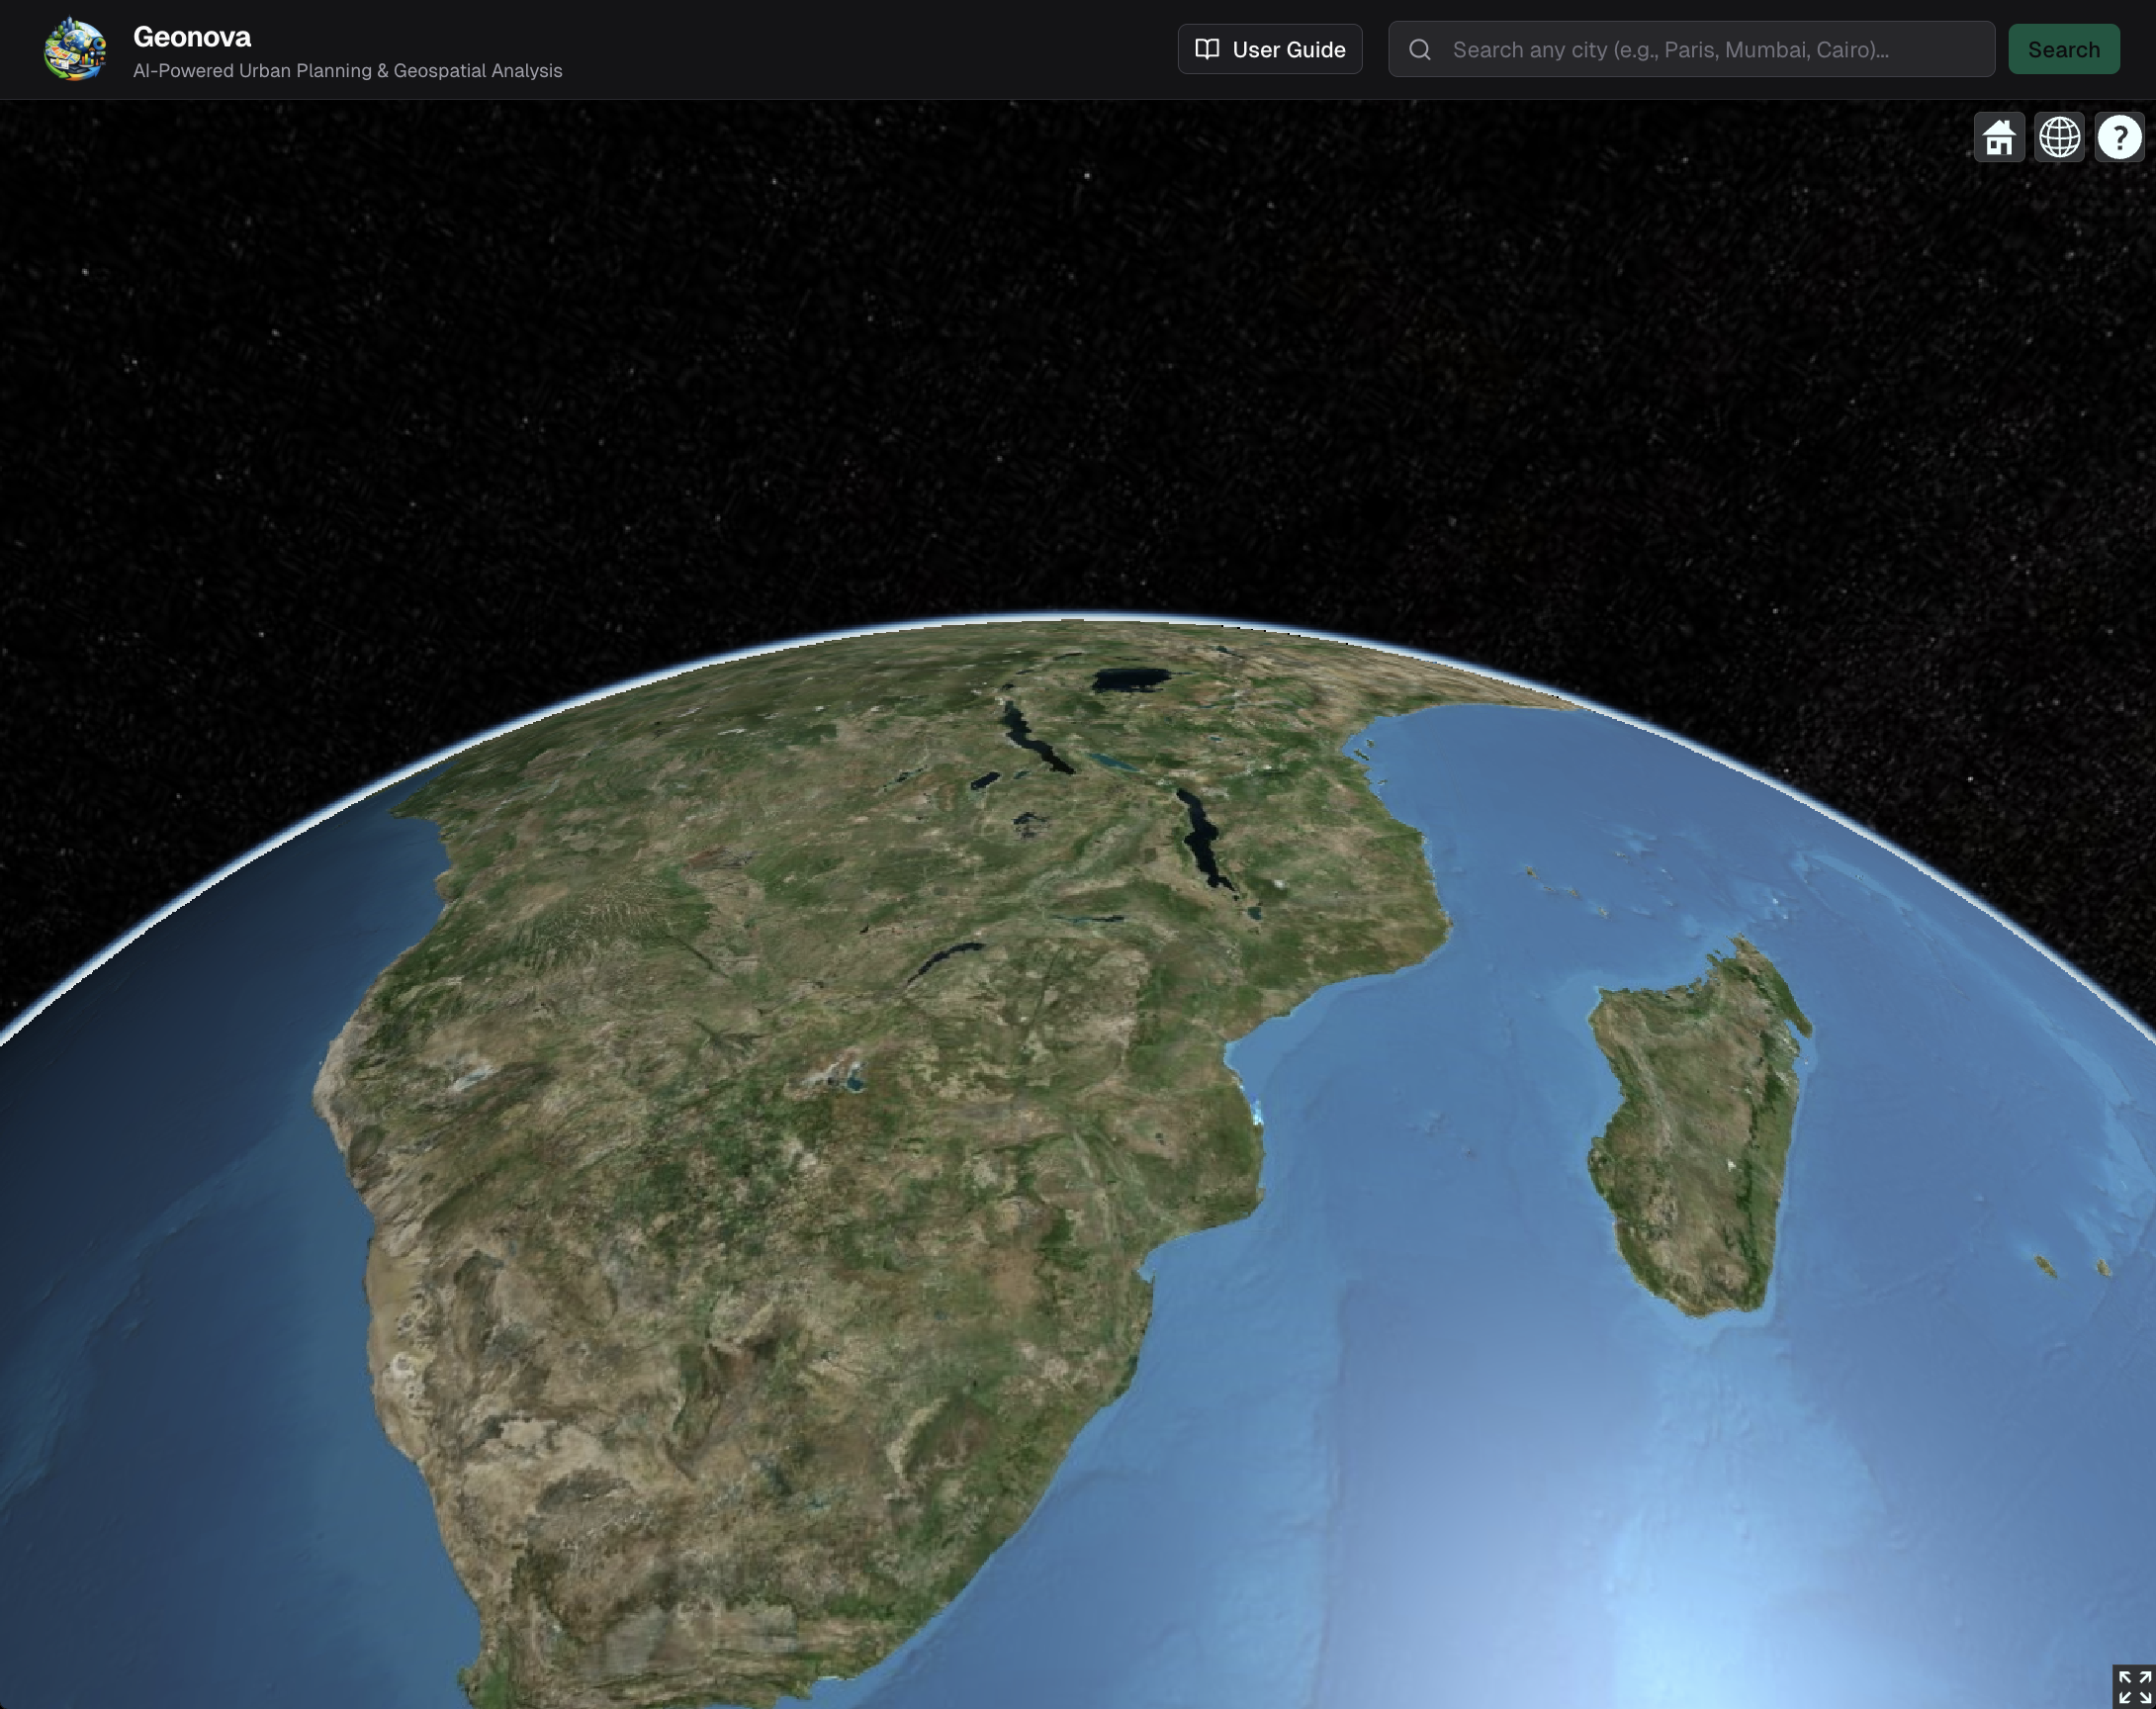
Step 1: Search for a Location
Use the search bar at the top right of the screen to enter any city name (e.g., "New York", "Tokyo", "London"). Press Enter or click the Search button. The globe will fly to your selected location and display it in detailed 3D.
Exploring the 3D Globe
Once you've searched for a location, you can interact with the 3D globe using these controls:
🔄 Rotate
Click and drag to rotate the globe and view the city from different angles.
🔍 Zoom
Scroll your mouse wheel or use pinch gestures to zoom in and out. Get close to see individual buildings in 3D.
↕️ Tilt
Hold Ctrl (or Cmd on Mac) and drag to tilt the camera and view the terrain from different perspectives.
👆 Pan
Right-click and drag to pan across the map without rotating the view.
Understanding the Analysis Panel
When you select a location, a detailed analysis panel appears on the right side of the screen with several sections:
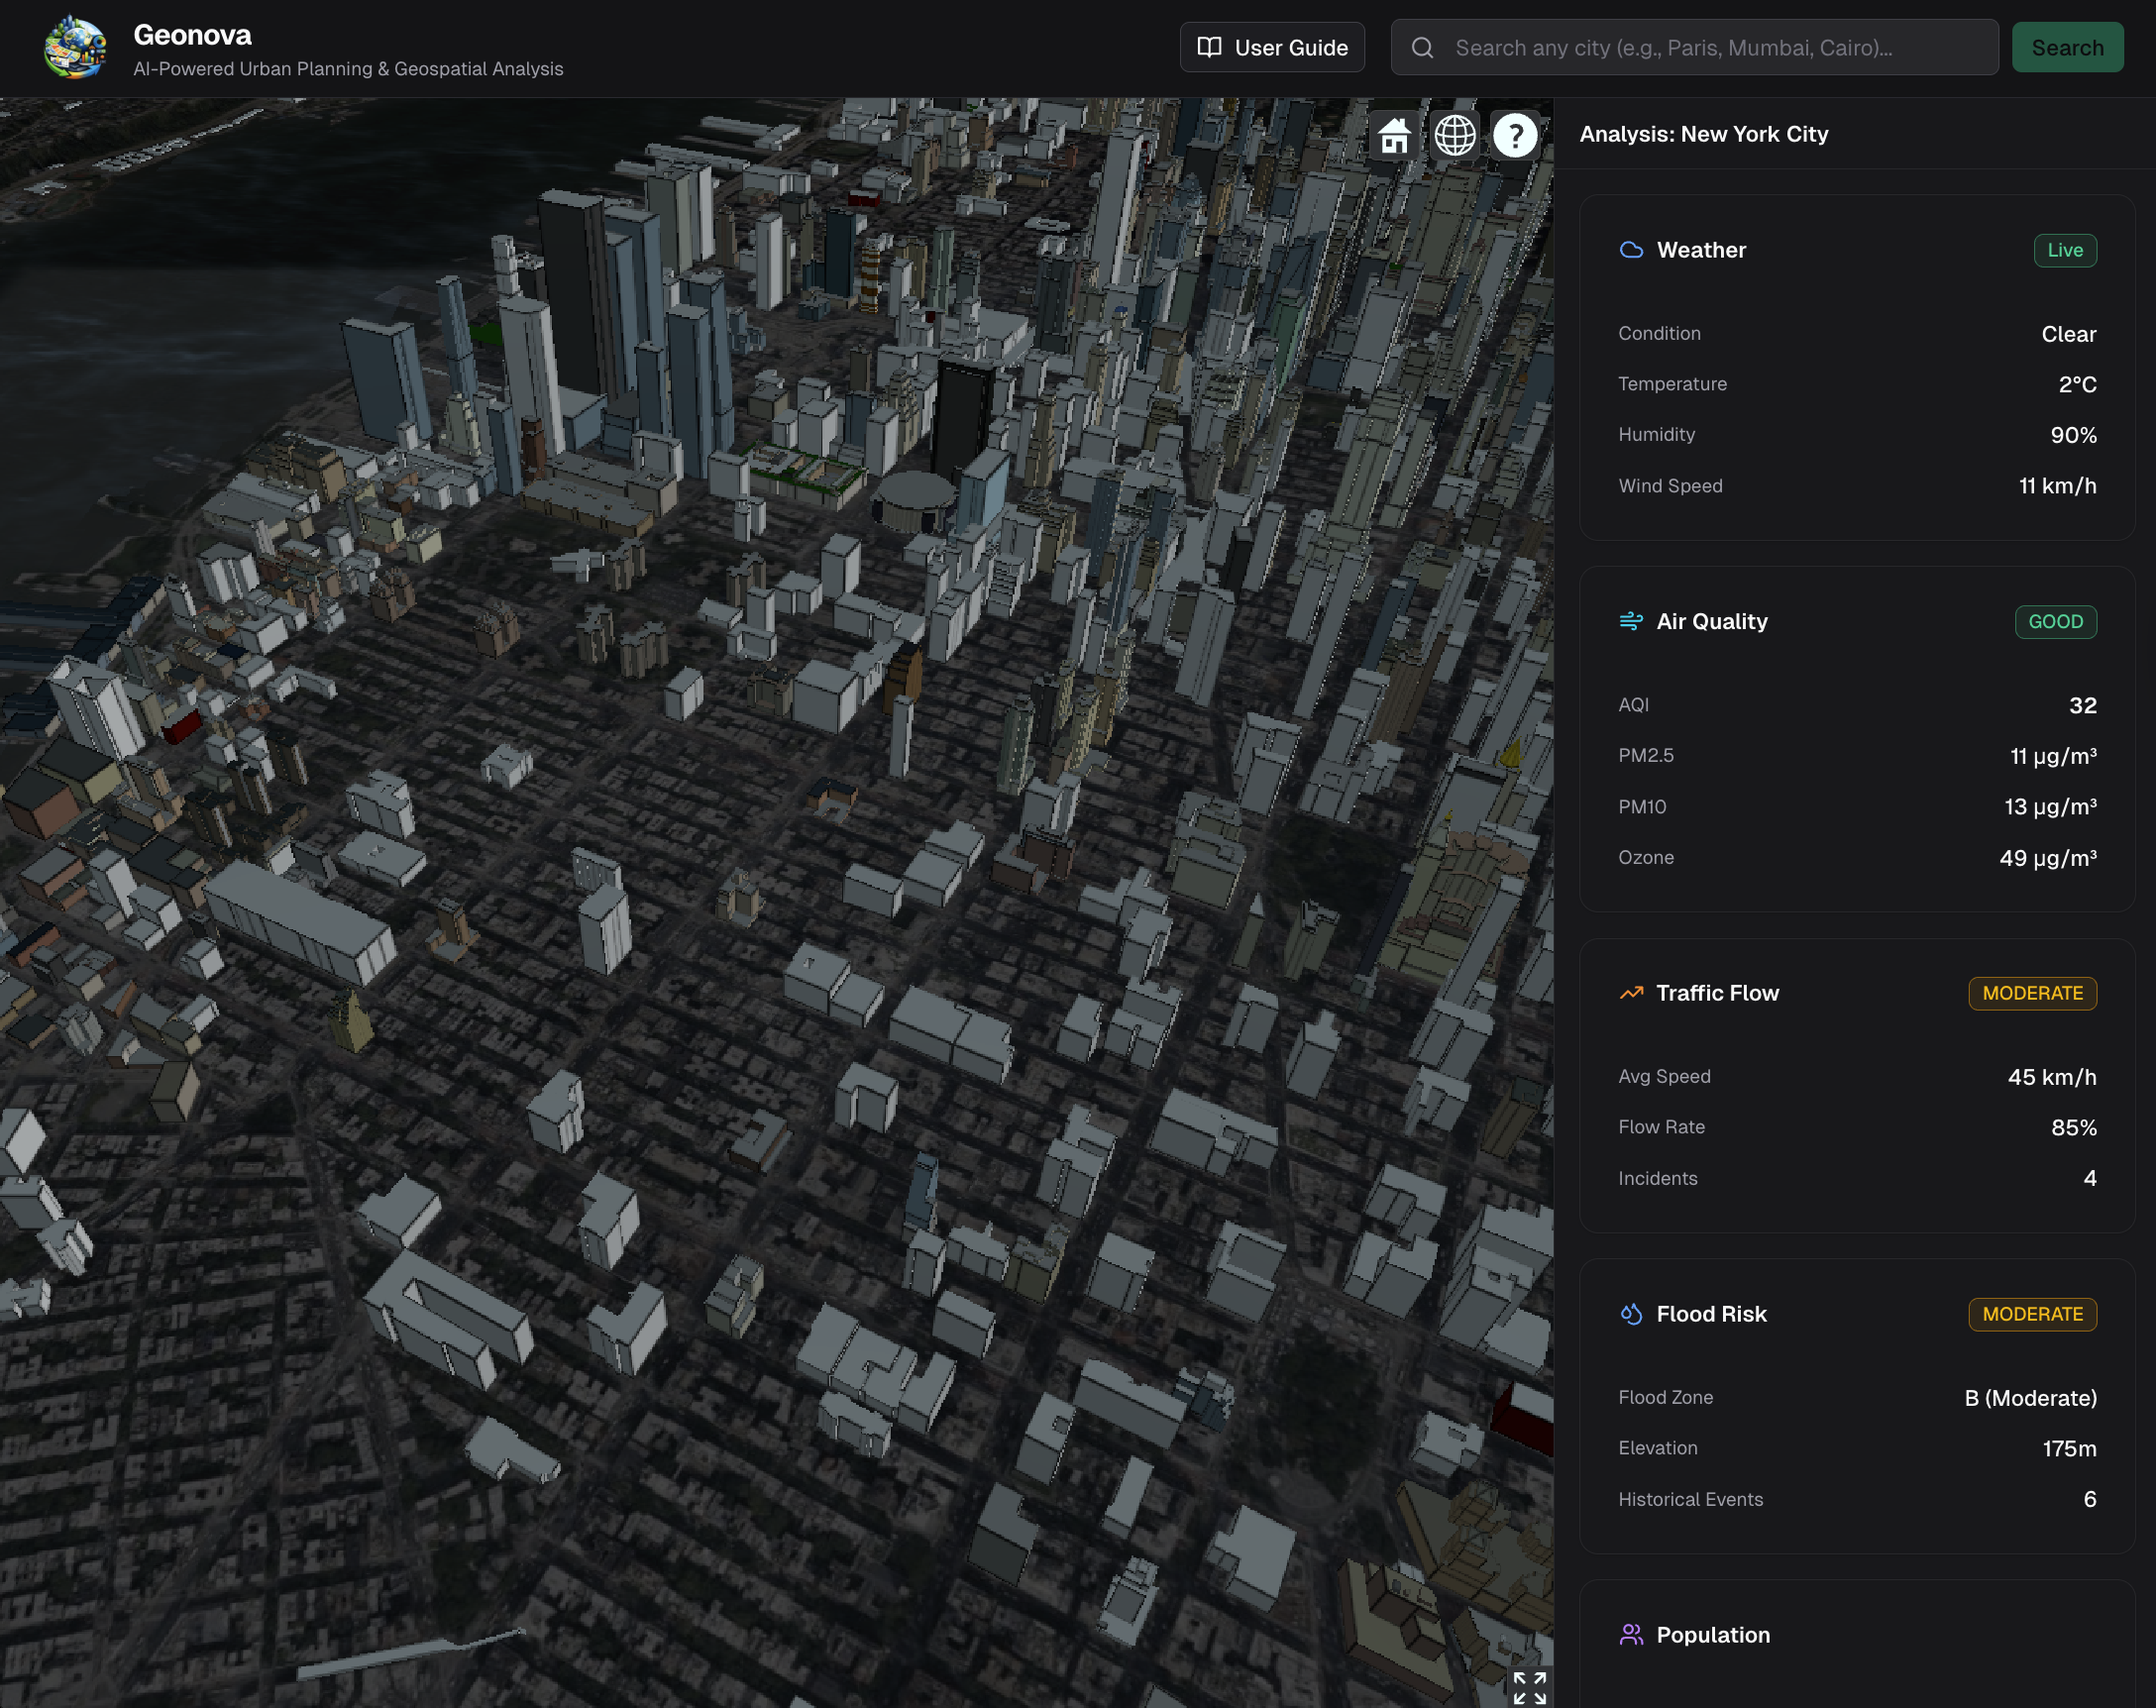
1Live Data Panel
Shows real-time environmental and urban indicators including weather conditions, air quality index, traffic patterns, flood risk assessment, population statistics, and climate data. Each metric is color-coded (green = good, yellow = moderate, red = poor).
2Spatial Analysis
Analyzes density metrics (population per square km, building coverage, street connectivity), green cover analysis (parks, trees, vegetation percentage), connectivity patterns (road network density, transit accessibility), and zoning distribution (residential, commercial, industrial, mixed-use areas).
3Urban Planning Recommendations
Provides AI-generated planning recommendations based on analysis results. Includes comparisons with reference cities like Copenhagen and Singapore, specific interventions (transit-oriented development, green infrastructure, mixed-use zoning), and future growth scenarios with population projections and infrastructure requirements.
3D Planning Visualizations
Geonova automatically renders planning recommendations directly onto the 3D globe using colored overlays and extruded volumes:
🌳 Green Corridors
Proposed park networks and vegetation zones.
🏢 Mixed-Use Zones
Areas recommended for residential and commercial integration.
🚇 Transit Corridors
Proposed bus rapid transit and metro extensions shown as colored lines.
🏗️ High-Density Development
Extruded volumes showing recommended building heights and density.
Tips and Best Practices
🌆 Start with Major Cities
For the most detailed 3D buildings and terrain data, search for major metropolitan areas like New York, London, Tokyo, or Singapore.
⏳ Wait for Analysis to Complete
The spatial analysis and recommendations may take a few seconds to process. Watch for the loading indicators in the sidebar panels.
🔀 Explore Multiple Cities
Compare different cities by searching for new locations. The analysis will automatically update for each new search.
🎨 Use the 3D Overlays
After analysis completes, colored polygons and lines will appear on the globe showing planning recommendations. Zoom in close to see the details.
Technical Requirements
- •Modern web browser (Chrome, Firefox, Safari, or Edge) with WebGL support
- •Stable internet connection for loading map tiles and analysis data
- •Recommended minimum 8GB RAM for smooth 3D rendering
- •Dedicated graphics card recommended for best performance